
A Look at Online Advertising Trends from 2005 – 2016
A Look at Online Advertising Trends from 2005 – 2016
Posted in News by Digital Marketing Insights on May 12, 2016.
People like online advertising, a lot.
There’s long been a standing statement that “people hate advertising“. I (and many others in this industry) don’t believe that this is true. In actuality, “people hate bad advertising.”
Nobody loves being annoyed and interrupted. Everybody loves to be entertained and informed. It’s when advertising follows the latter, that the campaign is successful.
Digital advertising brings with it many sets of bigger and scarier issues: tracking, fraud, re-targeting, and more. It’s perhaps because of this, that we now have ad blocking.
When it comes to key topics in the advertising space, 2016 has been the year of ad blocking. What happens when consumers use technology to block ads? How big is the ad blocking market? If the browsers and platforms build ad blocking into their operating systems, what chance do brands, agencies and publishers have to make money in a world, where interruptive advertising is the main revenue source?
Just how healthy is digital advertising?
If you’re wondering just how healthy the state of digital advertising is, the Interactive Advertising Bureau (IAB) released their 2015 Internet Advertising Revenue Report. The numbers are impressive.
Annual Revenue 2005-2015 (USD$ billions).
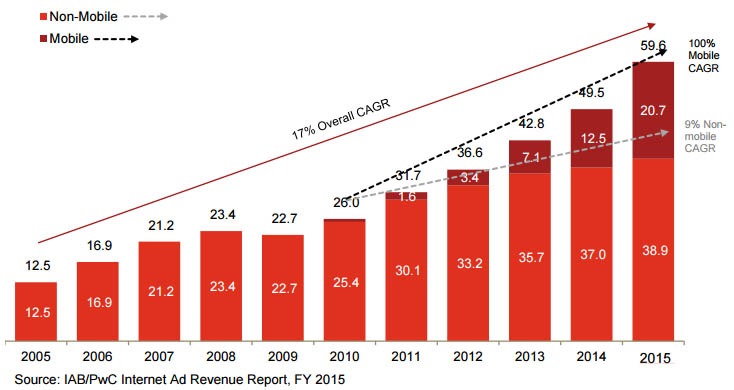
U.S. digital advertising revenue hit $60 billion USD ($82 billion AUD) last year. As expected, mobile was king. It grew 66%, from $13 billion USD ($18 billion AUD) in 2014 to $21 billion USD ($29 billion AUD) in 2015. So, as people and companies alike protest about the state of digital advertising, the industry just continues to soar.
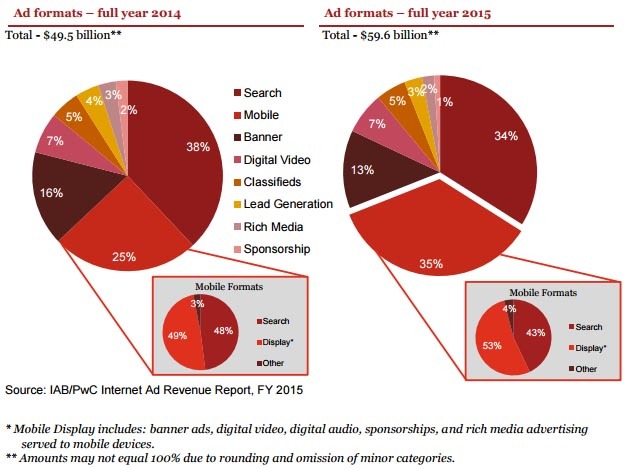
Who’s getting what out of this $82+ billion?
When it comes to the $11 billion USD ($15 billion AUD) spent on mobile last year, the vast amount of the spend was on display-related mobile formats such as video. This is a massive swing away from tradition search-related spend, for example, Google AdWords.
Still, if you dig into the report a little deeper you’ll finds that with all of this money spent, mobile mostly gets its spend from other media, digital media and through experimental budgets. What does this mean? Mobile-first media is still not mainstream and being funded the same way that media agencies work with TV, print, etc…
Video is King.
In what was a Google Search digital advertising world, the emerging ad format online is now video. Google still wins here because of YouTube. Video ads are the fastest growing (and most important) segment in digital advertising.
According to the IAB Report, non-mobile digital video advertising reached $4 billion USD ($5.5 billion AUD) last year (30% increase). To put that into perspective, social ads reached $11 billion USD ($15 billion AUD) last year (55% increase), while non-mobile search advertising reached $21 billion USD ($29 billion AUD) (8% increase).
There is no doubt that the landscape is dominated by Google and Facebook. For digital advertising dollars spent, it is the digital marketing world.
Who spends the most on digital advertising?
Retail advertisers spend the most, and they are responsible for 22% of dollars spent. After the retailers, auto and financial services come in. Each accounts for 13% of total advertising revenue. Overall, the IAB’s Internet ad revenue report revealed ad spending grew by 20%, up from 16% in 2014. An additional $10 billion USD ($14 billion AUD) in revenue.
The Takeaway:
Online Advertising is a $60 billion USD ($82 billion AUD) digital advertising industry, in the US alone, with no sign of slowing down!
What are you doing to compete in this growing market? How will you stand out from your competitors?
You can read the full IAB report here: IAB Internet Advertising Revenue Report Conducted by PricewaterhouseCoopers (PWC).
More Information About A Look at Online Advertising Trends from 2005 – 2016
For more information about A Look at Online Advertising Trends from 2005 – 2016, or any other digital marketing related questions you might have please get in touch.
Share A Look at Online Advertising Trends from 2005 – 2016
Like what you've seen in A Look at Online Advertising Trends from 2005 – 2016? Share it with your friends.